this post was submitted on 27 Jan 2024
512 points (85.0% liked)
Data Is Beautiful
7328 readers
75 users here now
A place to share and discuss data visualizations. #dataviz
founded 4 years ago
MODERATORS
you are viewing a single comment's thread
view the rest of the comments
view the rest of the comments
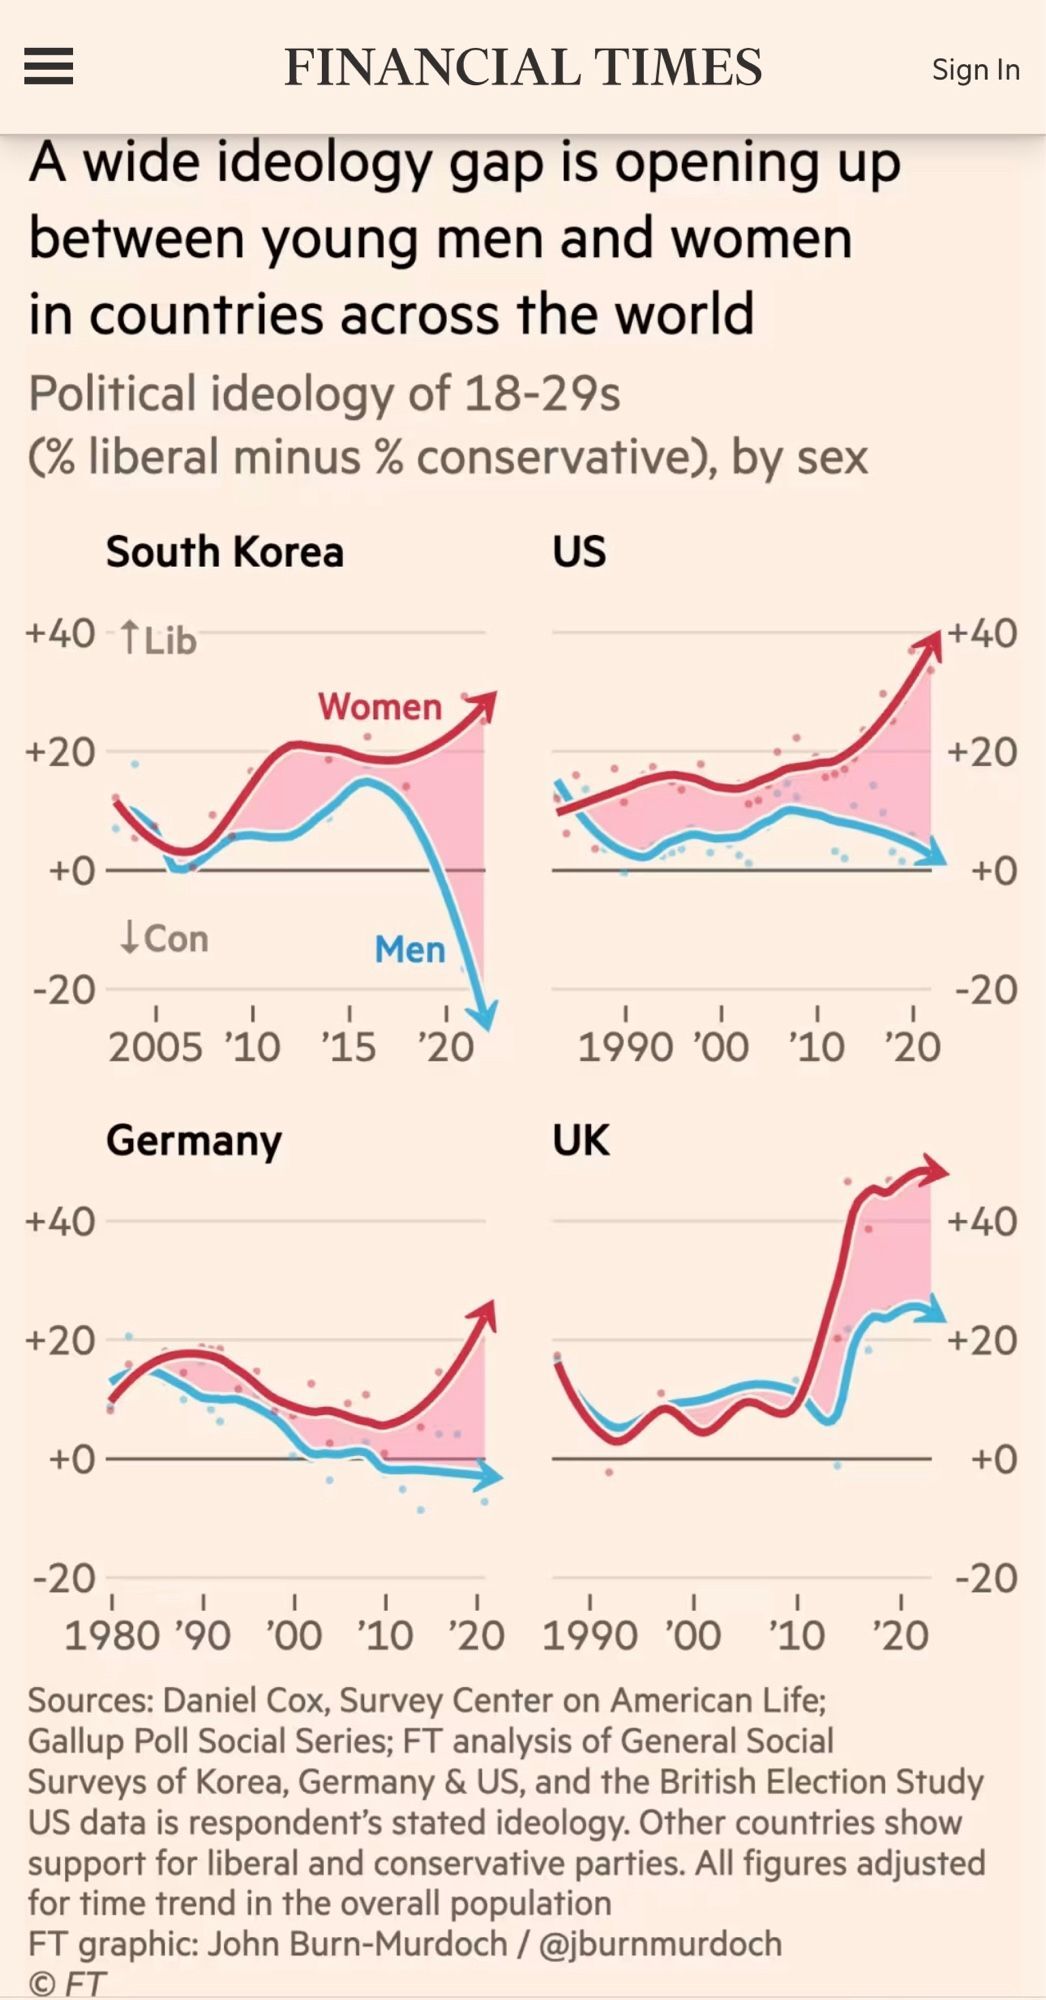
the graph explicitly takes 1 dimension of the spectrum to look at it in isolation. This is exactly what single graphs do best.
have you looked at the source of the graph?
Why would you intentionally look at this complex situation in 1 dimension. That dimension being the most overplayed talked about dimension because it creates conflict between groups based on identities. Instead of looking at the actual problem that the dimension completely ignores.