this post was submitted on 14 Jan 2022
2 points (100.0% liked)
COVID-19 Pandemic
978 readers
1 users here now
Any news or discussion around the pandemic. Anti-vaccination posts and comments will be removed, as well as personal attacks.
Relevant:
founded 3 years ago
MODERATORS
you are viewing a single comment's thread
view the rest of the comments
view the rest of the comments
So it could have been :
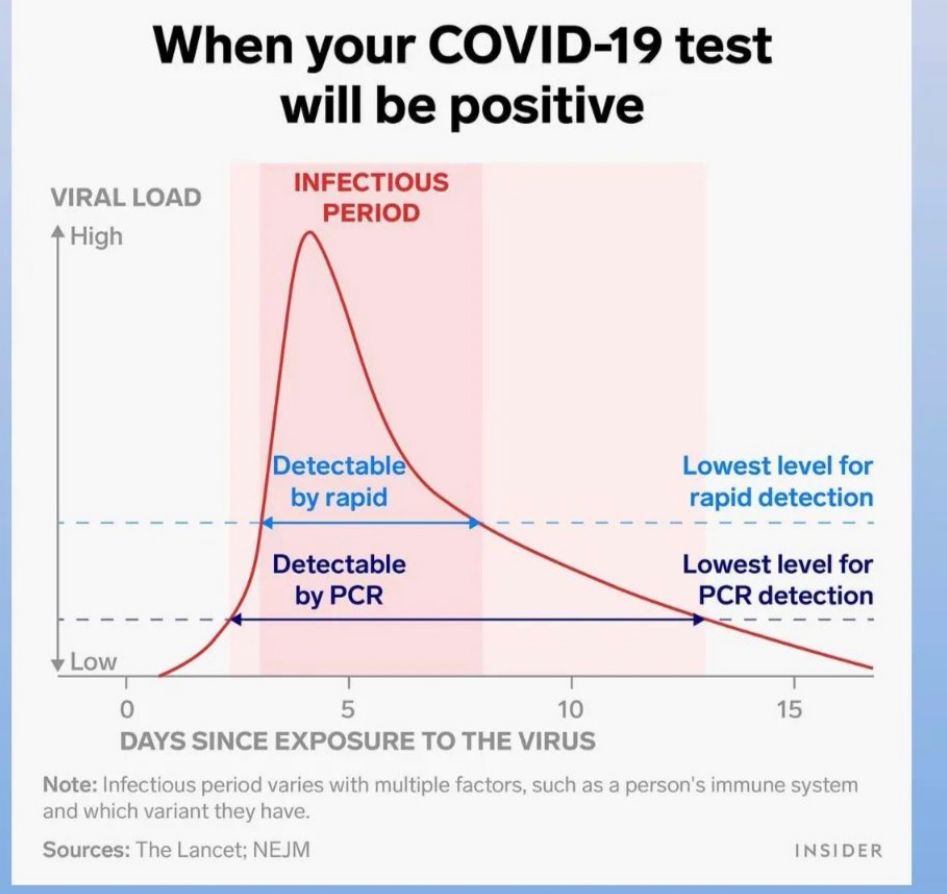
semi-logarithmicgraph"In science and engineering (...) a semi-logarithmic plot/graph has one axis on a logarithmic scale, the other on a linear scale."
But here :
1one axis has the scale : "low ... high" (which is qualitative),2the other has a linear scale (which is quantitative).so in this case and in this context :
semi-quantitativeseems fitting(?).Ah, I see where you're coming from.