this post was submitted on 16 Oct 2021
12 points (100.0% liked)

Open Source

32782 readers
580 users here now

All about open source! Feel free to ask questions, and share news, and interesting stuff!

Useful Links

Rules

Related Communities

Community icon from opensource.org, but we are not affiliated with them.

founded 5 years ago
MODERATORS
 

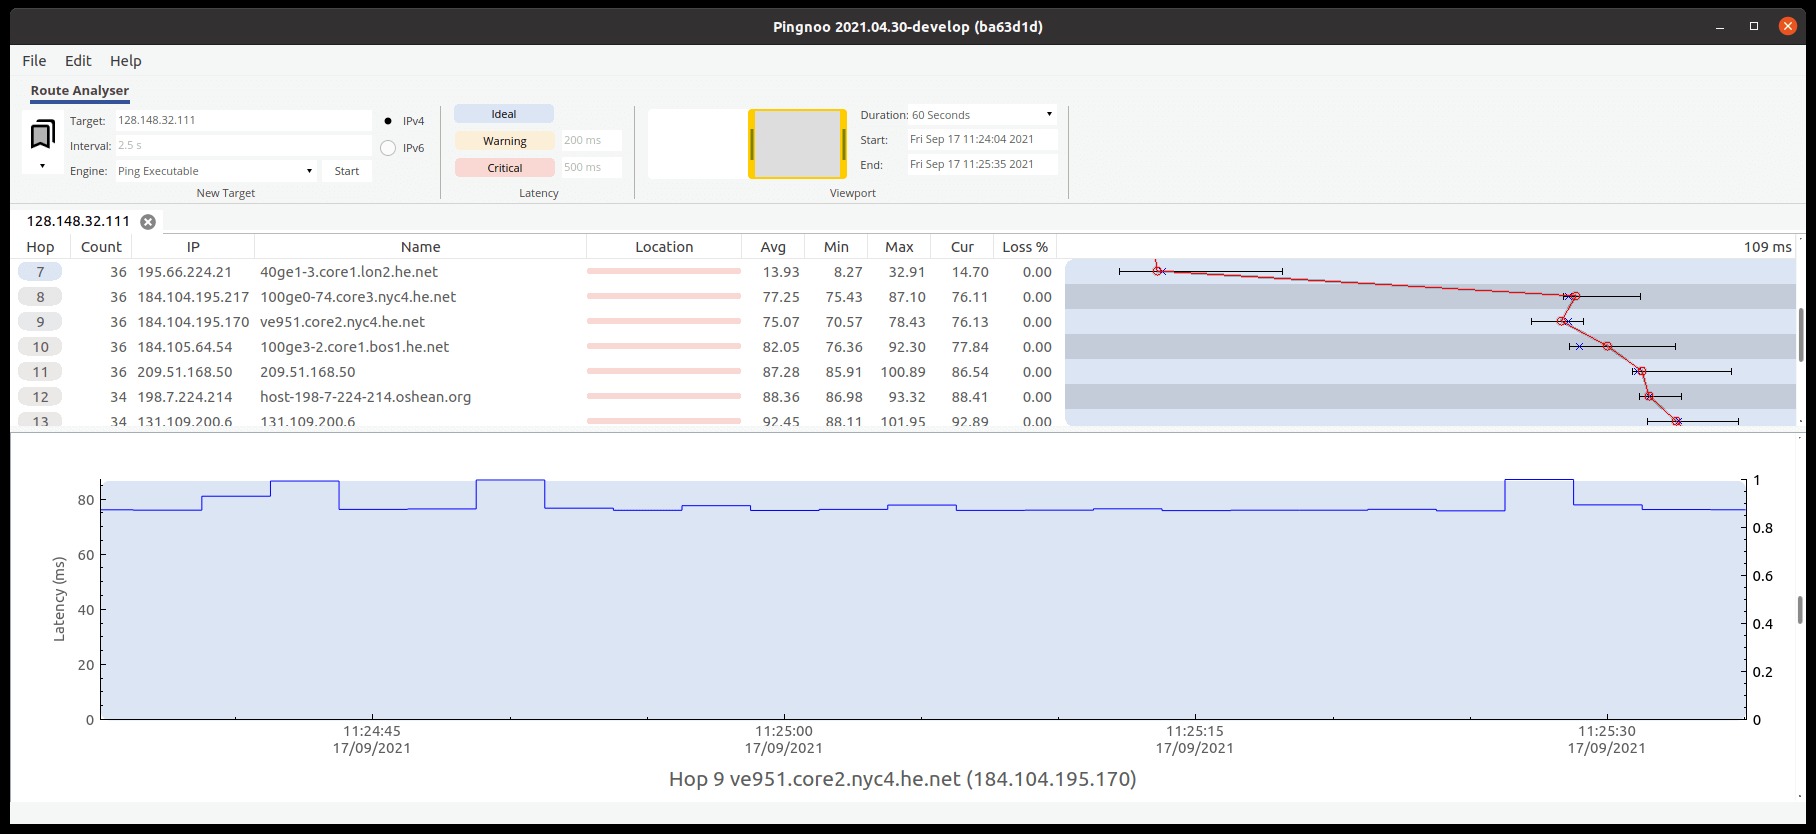
The software generates attractive graphs showing the history of each hop. The attractive visuals makes it easy to follow network routes and finding the causes of downtimes and poor network performance. This is helped by the software’s tab support, which lets you analyse multiple routes simultaneously.

The modular architecture of Pingnoo allows third parties to extend the features of the software. The main application binary is very small and only serves as a loader for components (aka plugins).

There’s support for IPv4 and IPv6. We can change the interval, and the duration of the viewport. For the latter, the default is 60 seconds, but there’s also durations of 10 minutes, 15 minutes, 30 minutes, 45 minutes, 1 hour, 12 hours, and 24 hours.

See https://www.linuxlinks.com/excellent-system-utilities-pingnoo-traceroute-ping-analyser/

#technology #opensource #networkutilities #pingnoo #networks

top 3 comments
sorted by: hot top controversial new old
[–] [email protected] 1 points 3 years ago (2 children)

I wonder what's the use case for most people for this? Testing VPNs? Choosing gaming servers?

[–] [email protected] 3 points 3 years ago

Well certainly those, but also troubleshooting problems with a slow network connection to pinpoint it, and if necessary showing stats to an ISP to prove the point as they usually have 100 other excuses.

[–] [email protected] 1 points 3 years ago

In Network Administration we also use it to understand the network map or infraestructure without checking every device manually.

General network troubleshooting is also other use.